Run your Visual Studio IDE, select Console App follow by clicking NEXT button.

Name our new project ScottPlotBarChart. Click NEXT.

Select any framework that suit you, in may case is .NET 8. Click NEXT.

On Solution Explorer, right click and select Manage Nuget Package.

On the pop up window, select Browser tab and type ScottPlot on text box. Soon after that select ScottPlot nuget package from the list below.

Now cut and paste the following code below and click F5 to run.
using ScottPlot;
using ScottPlot.Legends;
namespace ScottPlotBarChart
{
class Program
{
static void Main(string[] args)
{
Bar bar1 = new Bar();
bar1.Value = 75000;
bar1.Position = 1;
bar1.Size = 0.5;
bar1.FillColor = ScottPlot.Color.FromHex("AC92EB");
Bar bar2 = new Bar();
bar2.Value = 58000;
bar2.Position = 2;
bar2.FillColor = ScottPlot.Color.FromHex("4FC1E8");
bar2.Size = 0.5;
Bar bar3 = new Bar();
bar3.Value = 45000;
bar3.Position = 3;
bar3.FillColor = ScottPlot.Color.FromHex("A0D568");
bar3.Size = 0.5;
Bar bar4 = new Bar();
bar4.Value = 91500;
bar4.Position = 4;
bar4.FillColor = ScottPlot.Color.FromHex("FFCE54");
bar4.Size = 0.5;
Bar bar5 = new Bar();
bar5.Value = 67500;
bar5.Position = 5;
bar5.FillColor = ScottPlot.Color.FromHex("ED5564");
bar5.Size = 0.5;
Tick[] ticks =
{
new(1, "John"),
new(2, "Marry"),
new(3, "Martha"),
new(4, "Isac"),
new(5, "Harleen"),
};
Plot myPlot = new();
myPlot.HideGrid();
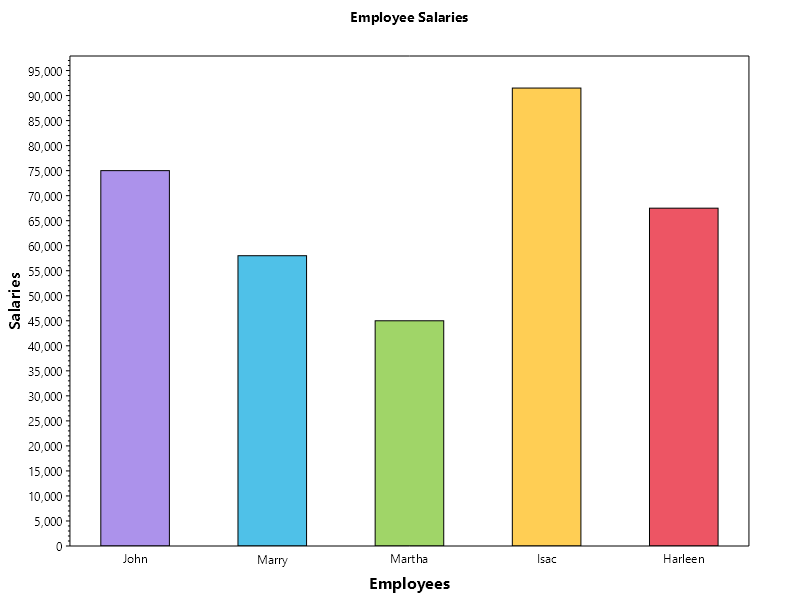
myPlot.Title("Employee Salaries", 14);
myPlot.XLabel("Employees");
myPlot.YLabel("Salaries");
myPlot.Add.Bar(bar1);
myPlot.Add.Bar(bar2);
myPlot.Add.Bar(bar3);
myPlot.Add.Bar(bar4);
myPlot.Add.Bar(bar5);
myPlot.Axes.Bottom.TickGenerator = new ScottPlot.TickGenerators.NumericManual(ticks);
myPlot.Axes.Bottom.MajorTickStyle.Length = 0;
myPlot.Axes.Margins(bottom: 0);
myPlot.SavePng(@"c:\ScottPlotBarChart.png", 800, 600);
myPlot.Dispose();
}
}
}
After you ran the code above you would see a png file been generated.
If you want the source code, please click on this link
