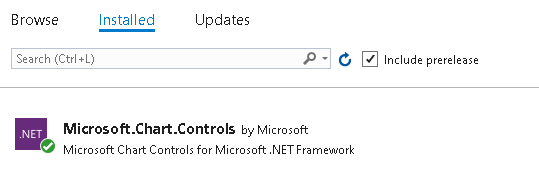
Creating a simple chart and save it as an image file is very handy in .NET FRAMEWORK 4.7.2. On your project you just need to add a package called Microsoft.Chart.Controls.
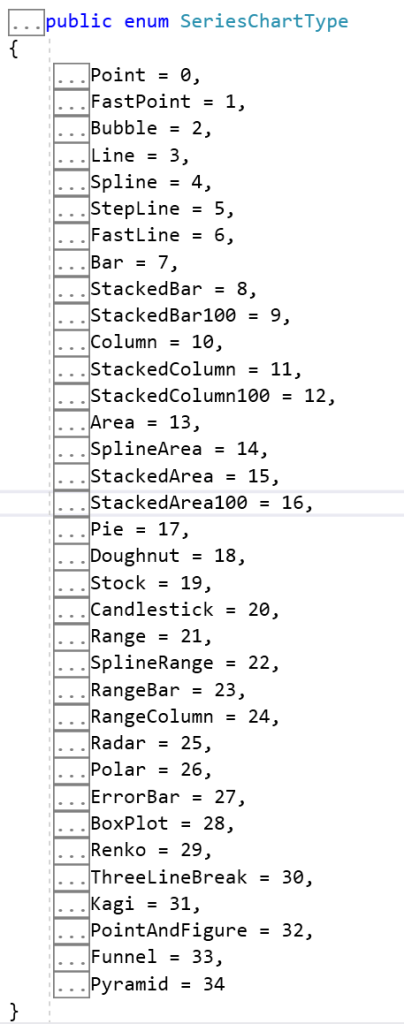
This nuget package supports upto 34 different chart type.
Copy and paste the following code below on your .NET Framework console project.
using System.IO;
using System.Drawing;
using System.Runtime.Serialization.Json;
using System.Windows.Forms.DataVisualization.Charting;

namespace ConsoleApp5
{
    class Program
    {
        static void Main(string[] args)
        {
            // Create a chart object
            Chart chart = new Chart();

            // Set chart title and dimensions
            chart.Titles.Add("Alarm History");
            chart.Size = new Size(1000, 800);

            // Create a chart area and add it to the chart
            ChartArea chartArea = new ChartArea();
            chartArea.Name = "Sample Chart Area";
            chart.ChartAreas.Add(chartArea);

            // Create a data series and add it to the chart
            Series series1 = new Series();
            series1.LegendText = "Front Freezer";
            series1.Color = Color.Red;
            series1.BorderWidth = 5;
            series1.Points.AddXY("08/22", 700);
            series1.Points.AddXY("09/22", 450);
            series1.Points.AddXY("10/22", 550);
            series1.Points.AddXY("11/22", 518);
            series1.Points.AddXY("12/22", 460);
            series1.Points.AddXY("01/23", 670);
            series1.Points.AddXY("02/23", 745);
            series1.ChartType = SeriesChartType.Line;

            Series series2 = new Series();
            series2.LegendText = "Cool Room";
            series2.Color = Color.Blue;
            series2.BorderWidth = 5;
            series2.Points.AddXY("08/22", 530);
            series2.Points.AddXY("09/22", 600);
            series2.Points.AddXY("10/22", 800);
            series2.Points.AddXY("11/22", 828);
            series2.Points.AddXY("12/22", 850);
            series2.Points.AddXY("01/23", 810);
            series2.Points.AddXY("02/23", 805);
            series2.ChartType = SeriesChartType.Line;
            chart.Series.Add(series1);
            chart.Series.Add(series2);

            Legend legend1 = new Legend();
            legend1.Enabled = true;
            legend1.Docking = Docking.Bottom;
            chart.Legends.Add(legend1);

            // Save the chart as an image file
            using (MemoryStream ms = new MemoryStream())
            {
                chart.SaveImage(ms, ChartImageFormat.Png);
                byte[] imageBytes = ms.ToArray();
                File.WriteAllBytes(@"c:\sample_chart.png", imageBytes);
            }
        }
    }
}
The output of the running code look like this.

Click here to download the code.
